Crucial Techniques for Precisely Calculating the Relative Strength Index (RSI)
Fundamental Elements for Accurate RSI Calculation

The Relative Strength Index (RSI) serves as an essential momentum oscillator, quantifying the speed and variability of price movements. Operating on a scale from zero to one hundred, it calculates its value by comparing the average gains to the average losses over a specific period. This calculation enables traders to assess the strength of price movements across various asset types, including stocks, commodities, and cryptocurrencies.
To derive the RSI, the initial step involves determining the average gains and average losses over a specified timeframe. The formula for RSI is RSI = 100 – (100 / (1 + RS)), where RS represents the ratio of average gain to average loss. This formula provides a precise numerical value that indicates market momentum.
A comprehensive understanding of the components involved in RSI calculation is crucial for traders. This knowledge allows for accurate interpretation of the oscillator’s readings, enabling informed trading decisions based on current market conditions. By mastering these foundational concepts, traders can effectively navigate the complexities of price movements across different markets.
Selecting the Optimal Timeframe for RSI Calculation
Traders typically employ a fourteen-period timeframe for RSI calculations, striking an ideal balance between responsiveness and reliability. This standard timeframe captures enough data to reflect significant price movements while minimising noise from brief fluctuations. The fourteen-period RSI is widely recognised in trading circles, solidifying its status as a key benchmark.
Utilising a fourteen-period timeframe helps the RSI identify potential reversal points within ongoing trends. Shorter periods may react excessively to price shifts, resulting in misleading signals, while longer periods may overlook critical turning points. Achieving this balance is vital for traders aiming to identify optimal entry and exit opportunities.
Traders should also consider their trading styles when determining the appropriate period for RSI calculations. Day traders may favour shorter periods, while swing traders might prefer longer ones to capture broader market trends. A solid understanding of the implications of period selection can significantly impact trading outcomes.
Practical Data Smoothing Techniques for RSI Calculations
Data smoothing is a vital aspect of RSI computation, as it mitigates noise from raw price changes. A commonly used technique is exponential averaging, which places greater emphasis on recent price movements while gradually diminishing the weight of older data. This method allows traders to discern sustained directional trends without significant signal delays.
Exponential smoothing contrasts with simple averaging, which treats all data points uniformly. By utilising exponential averages, traders can react more swiftly to market shifts, thereby enhancing their decision-making capabilities. This technique is especially beneficial in volatile markets, where rapid price changes can obscure underlying trends.
Incorporating data smoothing techniques into RSI calculations yields clearer signals and improved trading results. Traders gain a more accurate understanding of market momentum, enabling effective reactions to changing conditions. Mastering these techniques is vital for proficient RSI analysis.
How Can Traders Effectively Interpret RSI Thresholds?
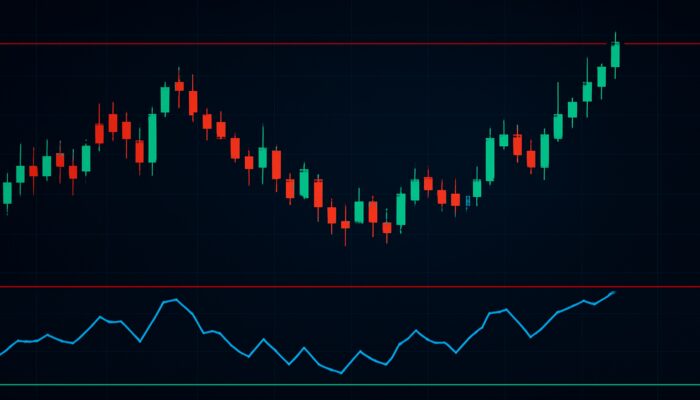
Detecting Signs of Overbought Conditions
An RSI reading above seventy generally indicates that an asset is overbought. This scenario occurs when buying pressure has excessively inflated prices, often leading to a potential price retracement. Traders must exercise caution when the RSI enters this overbought territory, as it suggests that momentum may be diminishing.
While overbought conditions do not necessarily compel an immediate sale, they require careful scrutiny of the market. Various financial instruments, including stocks, currencies, and commodities, can exhibit overbought traits. Recognising these conditions enables traders to prepare for potential reversals or corrections in price action.
Understanding the implications of an overbought RSI reading is crucial for effective trading. Traders can leverage this insight to set profit targets, adjust stop-loss orders, or even initiate short positions if other indicators support the likelihood of a price decline. Awareness of overbought conditions enhances overall trading strategy.
Identifying Oversold Conditions
Conversely, an RSI reading below thirty typically signifies that an asset is oversold. This condition emerges when selling pressure has excessively depressed prices, presenting an opportunity for a price rebound. Traders often regard oversold scenarios as buying opportunities, anticipating a shift in market sentiment as buyers re-establish control.
Similar to overbought conditions, oversold readings necessitate cautious interpretation. Although they indicate potential recovery phases, they do not guarantee immediate price increases. Traders should evaluate additional technical indicators and market trends to confirm possible reversal signals before making decisions.
Identifying oversold conditions is vital for traders aiming to capitalise on market rebounds. By monitoring RSI levels alongside price action and trading volume, traders position themselves to benefit from upward momentum as selling pressure diminishes. This proactive approach can lead to more successful trades.
Understanding the Dynamics of the Neutral Range

RSI levels between thirty and seventy indicate a neutral range where neither buyers nor sellers hold a definitive advantage in the market. Within this zone, price movements tend to demonstrate greater stability, allowing trends to develop further before reaching extremes. Traders often view this range as an opportunity to analyse market behaviour without rushing into decisions.
During neutral conditions, traders should remain vigilant for signs of potential trend shifts. Observing price action, volume, and other indicators can provide valuable insights into whether the market is poised to break out of the neutral zone. This information can shape future trading strategies and decisions.
Grasping the dynamics of the neutral range is essential for effective trading. It enables traders to maintain a balanced perspective, avoiding impulsive decisions based solely on extreme RSI levels. By recognising the significance of the neutral zone, traders can enhance their overall market analysis and decision-making processes.
What Steps Should Traders Follow to Identify Overbought Conditions?
Strategies for Validating Overbought Signals
To accurately detect overbought conditions, traders should seek validation from various indicators. When the RSI rises above seventy, it becomes essential to look for additional signals that support the possibility of a price reversal. This multifaceted strategy reduces the risk of false positives in volatile market environments.
Common confirmation tools include moving averages, candlestick patterns, and trend lines. For example, if the RSI indicates overbought conditions while a moving average crossover occurs, this alignment strengthens the case for a potential price correction. Traders should adopt a systematic approach to confirm signals before acting on them.
By employing confirmation steps, traders can refine their decision-making process and increase the probability of successful trades. This disciplined approach allows them to navigate market complexities with greater confidence, ultimately leading to more favourable outcomes.
Identifying Divergence Patterns
Recognising divergence patterns between price action and RSI readings is an effective method for detecting potential overbought conditions. A common scenario arises when the price forms higher highs while the RSI registers lower highs. This divergence indicates weakening momentum and suggests that a correction may be imminent.
Divergence patterns can occur in various forms, including regular divergence and hidden divergence. Regular divergence signifies a possible trend reversal, while hidden divergence may imply that the current trend is strengthening despite temporary fluctuations. Traders should familiarise themselves with these patterns to enhance their analysis.
Incorporating divergence pattern recognition into trading strategies can significantly improve decision-making. By identifying these signals early, traders can position themselves advantageously, potentially profiting from upcoming price corrections. This proactive approach enhances overall trading effectiveness and risk management.
Assessing Volume Correlation
Volume plays a crucial role in confirming overbought conditions. When the RSI indicates overbought levels, increasing volume during this period bolsters the likelihood of a reversal. Heightened trading activity typically suggests that market participants are taking profits, which can result in a price pullback.
On the contrary, if volume diminishes while the RSI remains overbought, it may indicate that upward momentum is still robust rather than waning. In such cases, traders should proceed with caution and consider the potential for further price increases before making decisions. Analysing volume alongside RSI readings offers a more comprehensive understanding of market behaviour.
Effective volume correlation analysis empowers traders to make informed decisions based on market dynamics. By integrating volume data with RSI readings, traders can bolster their ability to identify overbought conditions and respond appropriately. This holistic approach enhances overall trading strategies and risk management practices.
Evaluating the Duration of Overbought Conditions
Monitoring how long the RSI remains above the seventy threshold provides valuable insights into the sustainability of bullish pressure. Extended periods of overbought conditions may suggest that momentum is building, but they can also indicate an impending sharp correction as profit-taking occurs. Understanding this dynamic is essential for effective trading.
Traders should track the duration of overbought readings and analyse historical patterns to gauge potential outcomes. If the RSI remains elevated for an extended period, it may suggest that buyers are losing steam, increasing the likelihood of a price pullback. Conversely, brief spikes may indicate temporary overbought conditions.
Incorporating an assessment of overbought duration into trading strategies enables traders to make more informed decisions. By recognising the implications of prolonged overbought conditions, traders can better manage their positions and adapt to changing market dynamics. This proactive approach enhances overall trading effectiveness.
Comparing with the Stochastic Oscillator for Confirmation
Evaluating RSI overbought levels in conjunction with readings from the stochastic oscillator can provide additional confirmation of extreme conditions. When both indicators reflect overbought territory, it increases the likelihood of accurately identifying genuine tops rather than temporary price anomalies. This dual confirmation approach is invaluable for traders seeking to refine their strategies.
The stochastic oscillator assesses momentum based on the closing price relative to its price range over a specific period. When both the RSI and stochastic oscillator signal overbought conditions, it strengthens the case for a potential price reversal. Traders should integrate this comparison into their analysis for more robust decision-making.
Utilising the stochastic oscillator alongside RSI readings enhances the accuracy of identifying overbought conditions. This layered confirmation approach allows traders to navigate market complexities with greater confidence, ultimately leading to more favourable trading outcomes.
Expert Insights on RSI Overbought and Oversold Levels
Evaluating Historical Performance for Enhanced Trading Decisions
Examining historical market cycles reveals that RSI extremes often coincide with significant turning points across various timeframes and instruments. Analysing past performance provides traders with insights into how overbought and oversold conditions have influenced price movements, offering invaluable context for informed trading decisions.
For example, in the stock market, periods of extreme RSI readings often precede major corrections. By studying these patterns, traders can develop a deeper understanding of market sentiment shifts and their implications for future price actions. This knowledge significantly enhances their ability to anticipate potential reversals.
Incorporating historical performance evaluations into trading strategies allows traders to refine their approaches based on empirical evidence. By recognising recurring patterns associated with RSI extremes, traders can position themselves advantageously in the market, ultimately improving their trading success.
Integrating Risk Management Strategies into RSI Analysis
Incorporating RSI thresholds into risk management techniques is crucial for safeguarding capital during uncertain momentum shifts. Traders should establish clear stop-loss placements based on RSI readings to mitigate potential losses when overbought or oversold conditions arise. This proactive approach bolsters overall trading discipline and risk management.
For instance, when the RSI indicates overbought levels, traders might consider placing stop-loss orders just below key support levels. This strategy helps limit losses while allowing for potential price corrections. Conversely, during oversold conditions, stop-loss placements can protect against further declines.
By integrating risk management techniques into their trading strategies, traders can navigate market complexities with increased confidence. This disciplined approach enhances overall trading effectiveness and helps preserve capital under challenging market conditions.
Utilising Advanced Filtering Techniques for Improved Decision-Making
Incorporating complementary oscillators into RSI readings can create higher probability trade setups through professional analysis. For example, combining the RSI with the moving average convergence divergence (MACD) provides a more comprehensive view of market momentum. This strategy enables traders to filter out false signals and enhance their decision-making processes.
Real-world examples of advanced filter applications include using the RSI alongside volume indicators or trend analysis tools. By integrating multiple indicators, traders can develop a nuanced understanding of market dynamics, thereby enhancing their ability to identify potential entry and exit points.
Employing advanced filtering techniques in trading strategies enables traders to refine their analysis and increase the probability of successful trades. This multifaceted approach enhances overall trading effectiveness and equips traders to navigate market complexities with greater confidence.
What Factors Affect RSI Levels?
The Impact of Market Volatility on RSI Readings
Market volatility significantly impacts RSI readings, often pushing them towards extremes rapidly. In high-volatility environments, prices can fluctuate dramatically, resulting in quicker shifts in the RSI. Traders should recognise that heightened volatility may necessitate adjustments to traditional RSI thresholds to maintain accuracy in signal generation.
For example, during periods of increased volatility, RSI readings may frequently exceed seventy or fall below thirty. Traders may need to adapt their strategies by widening these thresholds to avoid premature signals. This flexibility is essential for effective trading in rapidly changing market conditions.
Understanding the relationship between market volatility and RSI levels enables traders to make more informed decisions. By adjusting their strategies according to volatility, traders can enhance their ability to navigate market complexities and improve overall trading outcomes.
The Influence of Trend Strength on RSI Behaviour
Strong directional trends can keep RSI readings within overbought or oversold territories for extended periods. In such cases, traders should exercise patience and seek secondary confirmations before acting on extreme RSI levels. Recognising the effect of trend strength on RSI dynamics is crucial for successful trading.
For instance, in a robust bull market, the RSI may remain above seventy for a prolonged duration without triggering a significant price correction. Conversely, during a strong downtrend, the RSI may linger below thirty. Traders should consider the prevailing trend when interpreting RSI readings to avoid false signals.
Incorporating trend strength analysis into trading strategies enhances overall effectiveness. By understanding how trends influence RSI levels, traders can make more informed decisions and position themselves advantageously in the market.
The Consequences of Timeframe Selection on RSI Analysis
The timeframe chosen for RSI calculations profoundly affects the frequency of extreme readings. Shorter intervals tend to produce more frequent extremes, while longer periods smooth out data and highlight major shifts in underlying momentum. Traders should align their trading style with the appropriate timeframe for RSI analysis.
For day traders, shorter timeframes may be more suitable for capturing rapid price movements. In contrast, swing traders might prefer extended periods to identify broader trends. Recognising the implications of timeframe selection is crucial for effective RSI analysis and decision-making.
By considering timeframe variations in RSI calculations, traders can tailor their strategies to align with their trading objectives. This adaptability enhances overall trading effectiveness and allows traders to navigate market complexities with greater confidence.
Proven Strategies for Managing RSI Overbought and Oversold Levels
Establishing Entry Rules for Purchasing Near Oversold Levels
Creating clear entry rules for buying assets close to oversold zones can significantly improve success rates. Traders should seek confirmation from candlestick patterns, such as bullish reversals, as the RSI approaches oversold levels. This strategy enhances the likelihood of identifying profitable entry points in the market.
For instance, if the RSI falls below thirty and a bullish engulfing pattern appears, this alignment strengthens the case for entering a long position. Traders should develop systematic entry rules based on these confirmations to refine their decision-making processes and boost their probability of success.
By implementing well-defined entry rules, traders can navigate market complexities with heightened confidence. This disciplined approach enhances overall trading effectiveness and allows traders to seize potential market recoveries.
Developing Exit Timing Protocols for Selling in Overbought Conditions
Establishing exit timing protocols for selling during overbought conditions is crucial for maximising profits. Traders should watch for divergences that signal the conclusion of upward movements when the RSI exceeds seventy. This proactive strategy enables traders to secure gains before potential price corrections occur.
For instance, if the price continues to rise while the RSI exhibits signs of divergence, it may indicate weakening momentum. Traders should consider exiting their positions to protect profits and avoid potential losses. Creating systematic exit protocols enhances overall trading discipline and effectiveness.
By implementing effective exit timing protocols, traders can navigate market complexities with greater confidence. This proactive strategy enhances overall trading outcomes and assists traders in managing their positions effectively.
Guidelines for Position Sizing Based on RSI Readings
Implementing position sizing guidelines based on the severity of RSI readings can help manage overall portfolio exposure judiciously. Traders should adjust their trade sizes in accordance with the strength of the RSI signal. For example, larger position sizes may be appropriate when the RSI indicates extreme overbought or oversold conditions.
Conversely, during neutral conditions, traders might prefer smaller position sizes to mitigate risk. This approach allows traders to tailor their exposure according to market dynamics, enhancing overall risk management. Understanding the connection between position sizing and RSI readings is vital for effective trading.
By incorporating position sizing guidelines into their strategies, traders can navigate market complexities with greater confidence. This disciplined approach enhances overall trading effectiveness and helps traders manage their capital prudently.
Implementing Robust Risk Management Techniques
Utilising proven risk management techniques is essential for protecting against false signals in volatile markets. Traders should establish stop-loss orders based on specific RSI thresholds to safeguard their capital. For instance, placing stop-loss orders just below key support levels when the RSI indicates overbought conditions can help mitigate potential losses.
Traders should adjust their stop-loss placements in response to market volatility. In high-volatility environments, broader stop-loss orders may be necessary to accommodate price swings. This flexibility enhances overall risk management and allows traders to navigate market complexities more effectively.
Integrating effective risk management techniques into trading strategies enables traders to preserve capital and ensure long-term trading success. This disciplined approach enhances overall trading effectiveness and empowers traders to manage market challenges with greater confidence.
Why is Regular Monitoring of Oversold Signals Essential?
Identifying Reversal Opportunities Promptly
Consistently tracking oversold signals enables traders to identify potential market bottoms early, positioning them to capitalise on recovery phases in price action. By monitoring RSI readings, traders can pinpoint moments when selling pressure may be subsiding, creating opportunities for profitable trades.
For instance, if the RSI indicates oversold conditions and bullish reversal patterns emerge, it may signal a favourable entry point. Traders who regularly monitor these signals can take advantage of market recoveries, enhancing their overall trading effectiveness.
By maintaining a disciplined approach to monitoring oversold signals, traders can improve their ability to spot potential reversal opportunities. This proactive strategy boosts overall trading outcomes and empowers traders to navigate market complexities with greater confidence.
Reducing the Risk of False Signals
Regularly reviewing RSI levels fosters familiarity with market context, helping traders filter unreliable oversold readings during strong downtrends. Understanding broader market dynamics is essential for distinguishing between genuine oversold conditions and false signals that could lead to premature entries.
For instance, during a strong downtrend, oversold RSI readings might persist without resulting in meaningful price recoveries. Traders should consider additional indicators and market sentiment before acting on oversold signals to avoid costly errors.
By incorporating a thorough analysis of market context into their trading strategies, traders can enhance their ability to avoid false signals. This disciplined approach improves overall trading effectiveness and aids traders in navigating market complexities with greater confidence.
Assessing Overall Portfolio Health
Ongoing observation of RSI levels supports balanced asset allocation decisions by highlighting when certain assets may be undervalued relative to recent performance. By regularly monitoring oversold signals, traders can identify opportunities to invest in assets with substantial recovery potential.
For example, if an asset consistently demonstrates oversold readings yet possesses strong fundamentals, it may present an attractive buying opportunity. This proactive strategy allows traders to benefit from potential undervaluations, thereby enhancing their overall portfolio performance.
By integrating portfolio health assessments into their trading strategies, traders can navigate market complexities with greater confidence. This disciplined approach enhances overall trading effectiveness and aids traders in managing their capital wisely.
Combining RSI with Other Analytical Tools for Optimal Results
Integrating Moving Average Crossovers with RSI
Combining RSI extremes with moving average crossovers enhances the reliability of trade signals generated. When the RSI indicates overbought or oversold conditions and a moving average crossover occurs, it strengthens the validity of these signals, thereby improving overall trading effectiveness.
For instance, if the RSI exceeds seventy and a short-term moving average crosses below a long-term moving average, it may indicate a strong potential for price reversal. This convergence of indicators provides traders with increased confidence in their decision-making processes.
By integrating moving average crossovers with RSI readings, traders can construct more robust trading strategies. This multi-dimensional approach enhances overall market analysis and supports traders in navigating market complexities with greater confidence.
Aligning RSI with Support and Resistance Levels
Identifying instances where RSI reaches extremes near established support or resistance zones often leads to stronger reactions worth monitoring closely. When the RSI indicates overbought conditions near a resistance level, it may signal a heightened likelihood of a price reversal.
Conversely, oversold conditions near support levels can imply potential buying opportunities. Traders should factor in these alignments when developing their trading strategies to enhance effectiveness and capitalise on market movements.
By integrating support and resistance alignments into RSI analysis, traders can improve their ability to identify potential reversal points. This disciplined approach enhances overall trading effectiveness and aids traders in navigating market complexities with greater confidence.
Combining Momentum Oscillators for Greater Accuracy
Integrating RSI with other oscillators, such as the stochastic oscillator, generates layered confirmation that reduces reliance on any single metric. This approach enhances the precision of identifying overbought and oversold conditions, providing traders with a comprehensive perspective on market momentum.
For instance, when both the RSI and stochastic oscillator indicate overbought conditions, it reinforces the case for potential price corrections. This dual confirmation strategy allows traders to navigate market complexities with greater confidence, ultimately leading to more favourable trading outcomes.
By incorporating momentum oscillator fusion into their trading strategies, traders can refine their decision-making processes and enhance overall trading effectiveness. This disciplined approach helps traders capitalise on market opportunities while effectively managing risk.
Avoiding Common Pitfalls in RSI Analysis
Risks of Over-Reliance on RSI
Relying solely on RSI without considering the broader market context can lead to premature entries that overlook prevailing trends. Traders should refrain from making decisions based exclusively on extreme RSI readings, as this may result in missed opportunities or unnecessary losses.
For instance, entering a long position based on an oversold RSI reading during a strong downtrend could lead to further losses. Traders should incorporate additional indicators and analyses to verify potential signals before taking action.
By maintaining a balanced perspective and avoiding over-reliance on any single indicator, traders can enhance their decision-making processes. This disciplined approach improves overall trading effectiveness and aids traders in navigating market complexities with greater confidence.
Challenges with Fixed Thresholds
Static RSI levels may not universally apply to all assets, so flexible adjustments based on historical performance can enhance overall effectiveness. Traders should be open to modifying their thresholds in response to market conditions and individual asset characteristics to improve their analysis.
For example, certain assets may exhibit different RSI behaviours, necessitating adjustments to conventional overbought and oversold levels. By assessing historical performance, traders can tailor their strategies to align with specific market dynamics.
Incorporating flexibility into RSI analysis allows traders to navigate market complexities with greater confidence. This disciplined approach enhances overall trading effectiveness and assists traders in managing their capital prudently.
Controlling Emotional Decision-Making in Trading
Adhering to predefined RSI rules helps mitigate impulsive reactions during extreme readings that may cloud judgment. Traders should establish clear guidelines for when to enter and exit positions based on RSI levels to avoid emotional decision-making.
For instance, if the RSI indicates overbought conditions, traders should resist the urge to cling to positions out of fear of missing out on potential gains. Instead, they should adhere to their exit protocols to secure profits and manage risk effectively.
By maintaining discipline in their trading strategies, traders can enhance overall effectiveness and navigate market complexities with greater confidence. This proactive approach improves decision-making processes and supports traders in achieving long-term success.
Frequently Asked Questions
What is the Relative Strength Index (RSI)?
The Relative Strength Index (RSI) is a momentum oscillator that measures the speed and change of price movements on a scale from 0 to 100, assisting traders in evaluating the strength of price actions.
How do you calculate the RSI?
The RSI is computed using the formula RSI = 100 – (100 / (1 + RS)), where RS is the average gain divided by the average loss over a designated period, typically fourteen days.
What do overbought and oversold levels signify?
Overbought levels (above 70) indicate excessive buying pressure, which may lead to a price pullback, whereas oversold levels (below 30) denote heavy selling, potentially preceding a price bounce.
How can I confirm overbought conditions?
Confirm overbought conditions by employing additional indicators such as moving averages, volume analysis, and divergence patterns to validate potential price reversals.
What is divergence in RSI analysis?
Divergence occurs when price action and RSI readings move in opposite directions, signalling potential trend reversals. For example, higher highs in price with lower highs in RSI indicate weakening momentum.
How does volume impact RSI readings?
Increasing volume during overbought conditions strengthens the likelihood of a reversal, while declining volume may suggest that upward momentum persists instead of waning.
What should I do during prolonged overbought conditions?
Monitor the duration of overbought conditions closely, as extended periods may foreshadow sharper corrections due to profit-taking. Adjust your trading strategy accordingly.
Can I use RSI for day trading?
Yes, RSI can be effective for day trading, particularly when paired with shorter timeframes to capture rapid price movements and identify potential entry and exit points.
What are common pitfalls in using RSI?
Common pitfalls include over-reliance on RSI without broader context, rigid threshold settings that may not apply to all assets, and emotional decision-making during extreme readings.
How can I enhance my RSI trading strategy?
Improve your RSI trading strategy by integrating additional indicators, maintaining discipline in your approach, and consistently reviewing historical performance to refine your analysis.
Explore Our Facebook Profile for More Insights!
The Article RSI Analysis Tips for Overbought and Oversold Levels Was Found On https://limitsofstrategy.com
The Article RSI Analysis Tips for Identifying Overbought and Oversold Levels found first on https://electroquench.com